


This financial planning webinar is all about learning easy-to-execute strategies to help you wrap data-driven, personalized insurance recommendations into your financial planning with complete transparency.
Please note: this session was recorded on May 20, 2025 and live attendance was required to be eligible for CE Credit.
During the webinar, we’ll create several projections that show how to easily model both existing or proposed life, disability, and critical illness insurance policies into your projections. We’ll also conduct highly personalized insurance needs analyses that will help us to determine if sufficient insurance coverage is in place.
As we move into the case study, we’re going to be building out multiple scenarios that we can compare and optimize.
Before we get into the session, let’s review some key reports you will see during the lesson.
Example of the critical illness Needs Analysis report summary
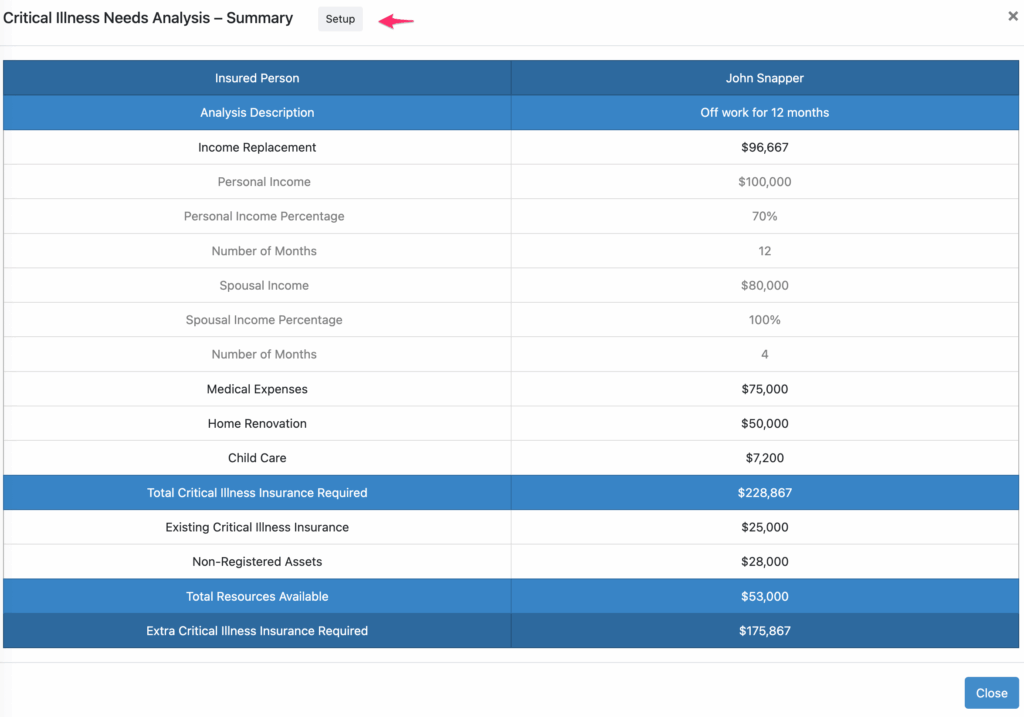
This module is highly customizable. The sections for medical expenses, home renovations, and child care have been added by the Advisor to provide the highest level of personalization.
In addition to your transparent and clear needs analysis reports, you will also have access to visual charts that show how insurance needs will change over time.
In this case, we’re looking at the chart for the life insurance needs analysis that has been done for a couple.
See how insurance needs change over time

This chart helps Advisors to visualize the personalized life insurance needs for individuals or couples over time.
You can see the gap between total life insurance required and total resources available. Because we have conducted a highly personalized life insurance needs analysis for John and his wife, we can provide a transparent, data-driven recommendation which we’ve included in the customizable comments section of the report builder.
Watch the insurance financial planning webinar now
Base case data entry details from the case study
We’ll be creating projections today for our clients James and Monica Chen. James is 40, and Monica is 39. They have 2 young children and are wondering if they’re on track for their goals and whether they have enough insurance in place.
We’ll start from our Clients page where we can access all of our previous projections and we’ll click create new client.
- Client
- James Chen
- Age: 40 (1985-01-01)
- Province: Ontario
- Monica Chen
- Age: 39 (1986-01-01
- General
- Start Year: 2025
- Retirement Age 60 and 59
- Projection until Age 100 and 99
- Rates of return as 1%, 2%, 5%
- Expenses
- Lots of flexibility to enter expenses (total, itemized, based on current spending or based on sustainable).
- Base Expenses of $105K
- Plus Additional Travel of $15,000 from 60 to 74.
- Gift to children of $60,000 at age 60. 0% Indexing
- Incomes
- $120K salary for James at General Inflation
- Mention the ability to pro-rate the date for a specific value.
- Mention the option to enter joint incomes (e.g., rental income)
- $180K salary for Monica at General Inflation
- Assets
- James
- Delete Default
- Non-reg $80K with $70K Cost Joint YES 30%/70%
- TFSA $130K at 100% Equity
- RRSP $90K at 20%/80%
- TFSA Contribution room of $7,000
- RRSP Contribution room of $50,000
- Monica
- Delete Default
- TFSA $130K at 100% Equity
- RRSP $140K at 20%/80%
- TFSA Contribution room of $7,000
- RRSP Contribution room of $32,400
- Home worth $750K with $600K cost JOINT
- Cottage worth $500K with $200K cost JOINT Taxable YES
- James
- Debts
- Home Mortgage of $350K at 5% with $2,200 monthly
- Cottage Mortgage of $150K at 5% with $1,000 monthly
- Gov’t Benefits
- James
- We’ll change the CPP Start Age to 65 and set the Percent of Maximum to 80%.
- OAS we’ll leave as 65 and 100%.
- Monica
- CPP Start Age 65
- Percent of Maximum to 85%
- James
- Insurance
- Add existing term life insurance
- Term 20 for James, $750K DB, $700 annual premium
- Term 20 for Monica, $900K DB, $600 annual premium
- Add existing disability insurance
- James has no existing coverage
- Monica has 60% coverage up to a maximum of $8K per month through work until age 58 in year 2044. Enter $96,000 of coverage and copy with $0 for the Premium.
- Add existing critical illness insurance
- James has an old policy “20 Year R&C” for $100K started when he was 30 and good until age 50 with a $500 premium.
- Monica has no existing coverage
- Add existing term life insurance
- RESP
- Family RESP
- $26,000
- Jeremy 2018-01-01, $3,000, $10,000, 3%, 18, 4
- Meghan 2020-01-01, $2,000, $10,000, 3%, 18, 4
- Personal Planning Page
- Move to individual Planning pages for James and max out TFSA
- $20,000 to RRSP for James
- Max TFSA and $25,000 to RRSP for Monica
- Walk through the Planning page from top to bottom.
- Review the Charts
Now that we’ve created our base projection for James and Monica, we can see that they’re on track for their target retirement if all goes according to plan. Next, we want to see what would happen if they experienced an adverse outcome such as an early death, disability, or illness.
Additional data entered to conduct Needs Analyses for life, disability, and critical illness insurance
- Needs Analysis – Life Insurance
- We’ll start with the Needs Analysis to review whether they have enough life insurance in place.
- Defaults to 1 analysis per client. Can delete them at the bottom or add more (up to 4 total).
- Description: Debt & Income to Retirement
- 61 years (use the “Projection end” button)
- General Inflation
- 2.5% Rate of Return
- Core Method
- This is typically the largest portion of the life insurance need. You can calculate it using an Income Replacement method or an Expense Coverage method
- Explain the two options and how they impact the section below.
- Use Income Replacement
- Set up for both James and Monica
- James
- $120K (use the “Employment Income” button)
- 50% (reduce for taxes and mortgage payment, which won’t be required anymore due to repaying the debt).
- 20 years (use the “Retirement” button)
- Monica
- $180K (use the “Employment Income” button)
- 50%
- 20 years (use the Retirement“ button)
- Debt Repayment 100%
- Education 100%
- Final Expenses $25,000 each
- Ability to rename
- Show the ability to add Other Liabilities
- Up to 5 total, can add and remove them from the top of the Liabilities section
- We’ll start with the Needs Analysis to review whether they have enough life insurance in place.
- Go to the Summary
- They each need ~$1MM of additional coverage for the next 10 years. Could look at a joint first or additional individual policies.
- Review the See Details to show the need over time
- Ability to customize the inputs
- Show the Graph view
- Go back and change the period to Retirement
- Needs Analysis – Disability Insurance
- Description: 60% Income Replacement
- Import Employment Income
- Enter 60%
- Discuss the 100% existing coverage and how Snap pulls that in from the Insurance page.
- Discuss the ability to enter other expected income sources (e.g., help from family).
- Click Summary at the top.
- Discuss the insurance need.
- Needs Analysis – Critical Illness
- Description: Recommended Coverage
- Import Employment Income
- Set the target to 70% for 12 months (for flexibility in case it’s not covered by DI, but they would prefer to have the flexibility).
- Set the target to 70% for the Spouse for 6 months
- Medical Expenses $10,000
- Home Modification $40,000
- They don’t want to use up any of their existing assets if possible.
- Click Summary at the top.
- Discuss the insurance need.
Next steps
Learn more about how to build existing or proposed Critical Illness Disability Insurance recommendations into your financial planning process.
Learn how to model corporately-owned life insurance in your next financial plan.


