
Home Equity Line of Credit (HELOC) is a revolving line of credit secured by your clients’ home. In Canada, your clients can access up to 65% of the value of their home through a home equity line of credit.
There are many reasons why your clients may want to consider HELOC and why you may want to have an easy illustration of HELOC in your financial planning software.
Why HELOC illustrations are important?
HELOC is an attractive option to access additional cash to fund retirement lifestyle or to cover unexpected expenses, typically at a much lower interest rate than a traditional line of credit.
In markets with elevated real estate prices, for example in Vancouver or Toronto, HELOC offers a solid alternative to downsizing, which which may not always be practical and carries additional costs.
How to effectively illustrate HELOC for your clients?
Here are a few useful tips on illustrating HELOC scenarios for your clients.
Illustrating HELOC can be accomplished in three easy steps. You can use Excel or your financial planning software. We are going to use Snap Projections financial & retirement planning software in this example.
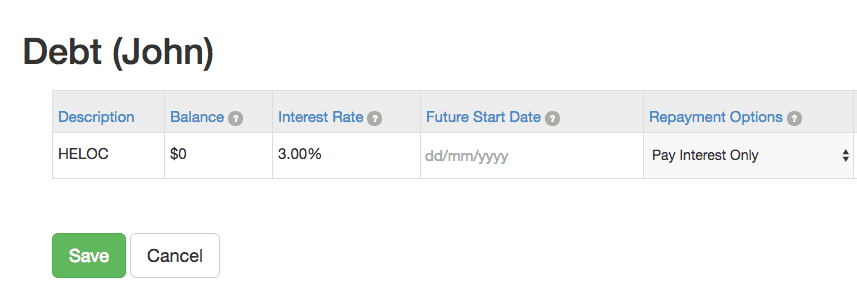
Step 1 – Add a new loan named HELOC with a $0 balance and the interest rate.
Step 2 – Enter the amount the client withdraws every year on the main scenario page. The amounts can be the same or they can be different for every year (or annually indexed at a specified percentage, e.g. at inflation).
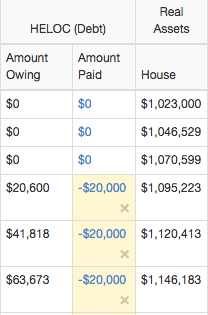
Step 3 – Click Run Scenario. The withdrawals from HELOC are added to your client’s cash flow and can be used to cover retirement lifestyle or other expenses.
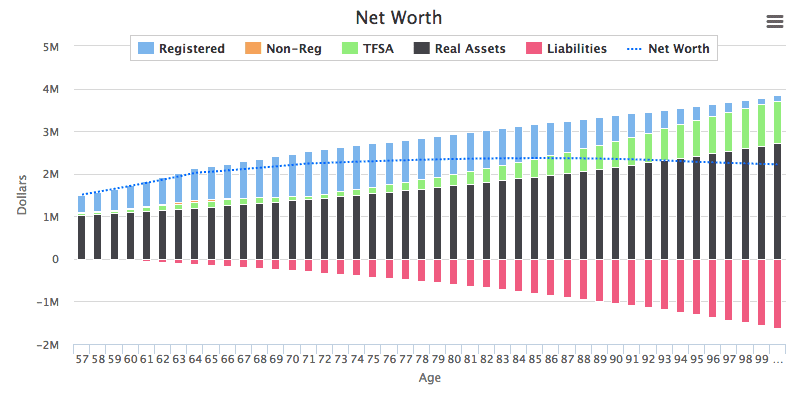
The Net Worth chart clearly illustrates client’s liabilities that are partially offset by increasing value of their home. Additionally, it is helpful to see the net worth line to visually evaluate the practicality of HELOC in each situation.
If you would like to learn more about illustrating HELOC scenarios for your clients and how to effectively incorporate them into your financial planning process, click here to book a short online demo with us and we’ll show you how to do that.
We hope these tips will help you better serve your clients with clarity and ease.
